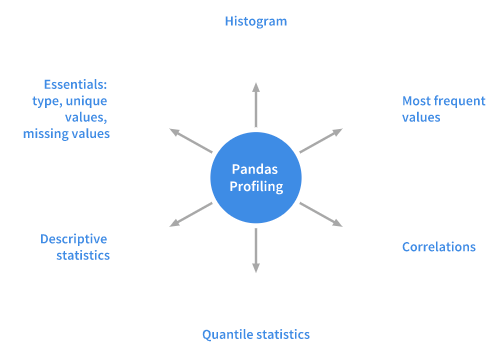
For a given dataset the pandas profiling package computes the following statistics:
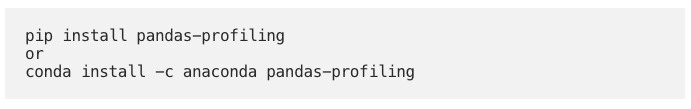
Installation
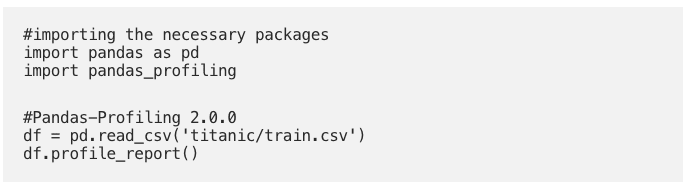
Usage
Let’s use the age-old titanic dataset to demonstrate the capabilities of the versatile python profiler.
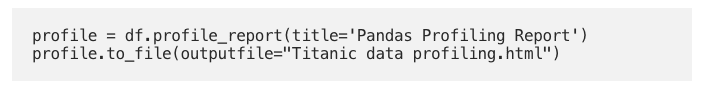
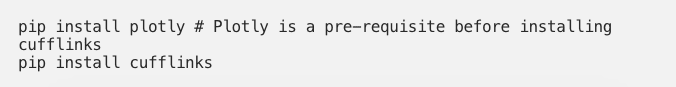
This single line of code is all you need to display the data profiling report in a Jupyter notebook. The report is pretty detailed including charts wherever necessary. The report can also be exported into an interactive HTML file with the following code. Cufflinks library binds the power of plotly with the flexibility of pandas for easy plotting. Let’s now see how we can install the library and get it working in pandas.
Installation
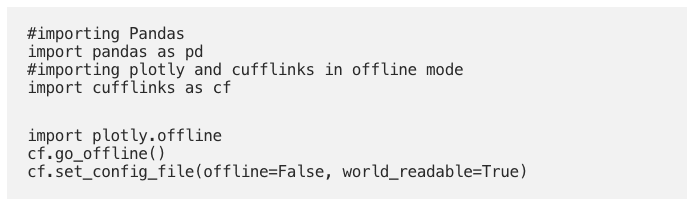
Usage
Time to see the magic unfold with the Titanic dataset.
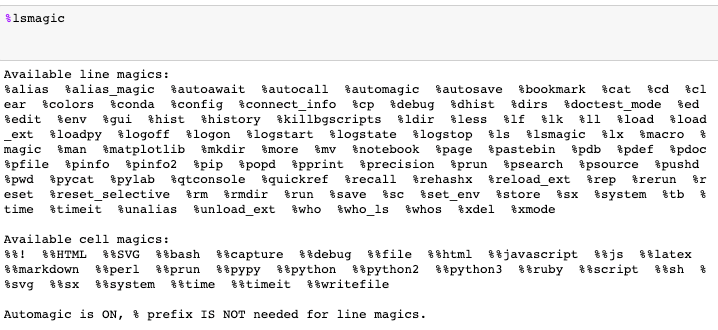
Click here for more examples. Magic commands are of two kinds: line magics, which are prefixed by a single % character and operate on a single line of input, and cell magics, which are associated with the double %% prefix and operate on multiple lines of input. Magic functions are callable without having to type the initial % if set to 1. Let’s look at some of them that might be useful in common data analysis tasks:
% pastebin
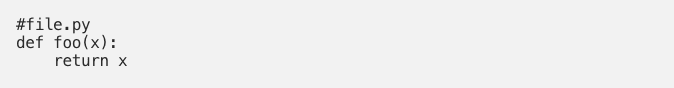
%pastebin uploads code to Pastebin and returns the URL. Pastebin is an online content hosting service where we can store plain text like source code snippets and then the URL can be shared with others. In fact, Github gist is also akin to pastebin albeit with version control. Consider a python script file.py with the following content:
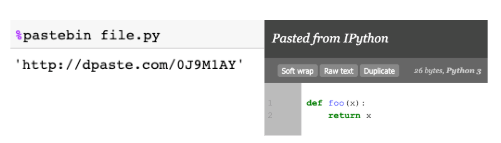
Using %pastebin in Jupyter Notebook generates a pastebin url.
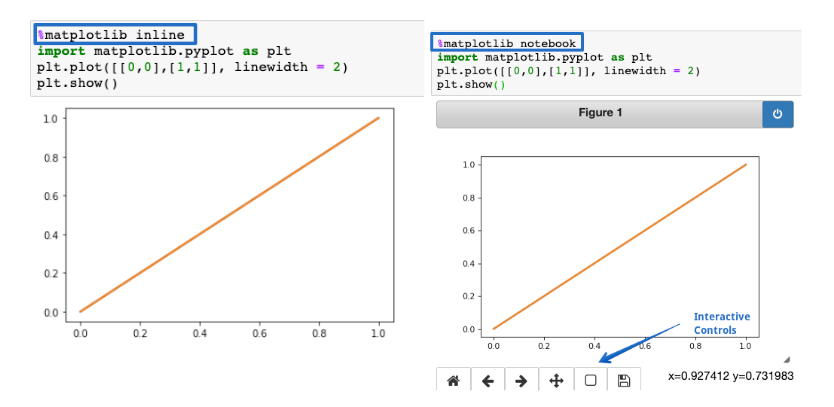
%matplotlib notebook
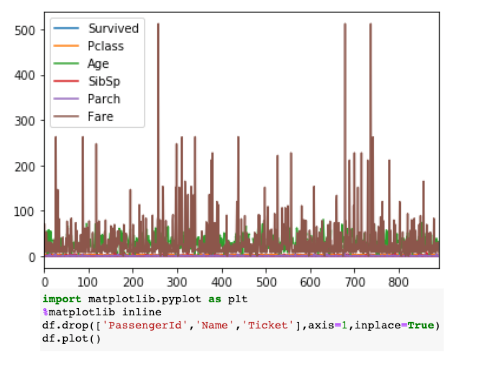
The %matplotlib inline function is used to render the static matplotlib plots within the Jupyter notebook. Try replacing the inline part with notebook to get zoom-able & resize-able plots, easily. Make sure the function is called before importing the matplotlib library.
%run
The %run function runs a python script inside a notebook.
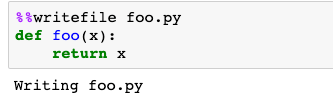
%%writefile
%%writefile writes the contents of a cell to a file. Here the code will be written to a file named foo.py and saved in the current directory.
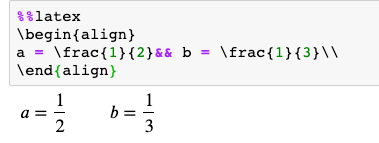
%%latex
The %%latex function renders the cell contents as LaTeX. It is useful for writing mathematical formulae and equations in a cell.
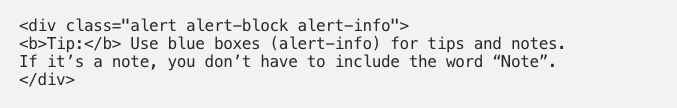
Blue Alert Box: info
Yellow Alert Box: Warning
Green Alert Box: Success
Red Alert Box: Danger
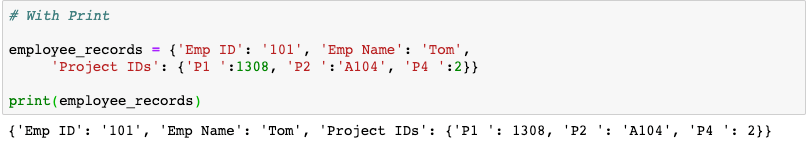
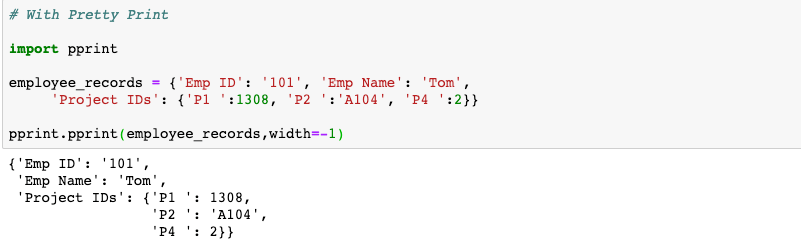
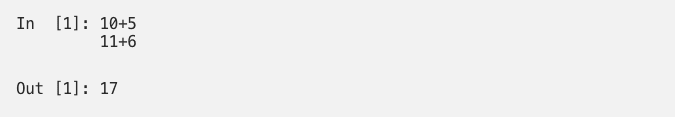
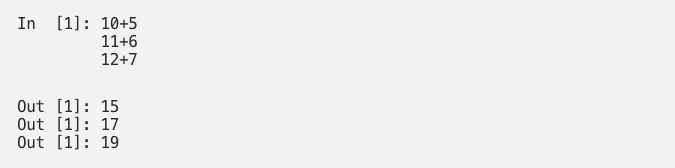
It is a normal property of the cell that only the last output gets printed and for the others, we need to add the print() function. Well, it turns out that we can print all the outputs just by adding the following snippet at the top of the notebook.
Now all the outputs get printed one after the other.
To revert to the original setting :
Firstly, once the end of the program is reached, python doesn’t exit the interpreter. As such we can check the values of the variables and the correctness of the functions defined in our program.
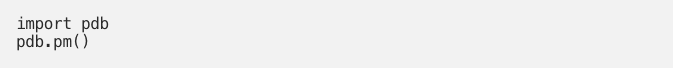
Secondly, we can easily invoke a python debugger since we are still in the interpreter by:
This will bring us to the position where the exception has occurred and we can then work upon the code. The original source of the hack.
In case you have deleted the contents of a cell, you can easily recover it by hitting CTRL/CMD+Z If you need to recover an entire deleted cell hit ESC+Z or EDIT > Undo Delete Cells
This article was written by Parul Pandey on Towards Data Science. You can read the original piece here.